

Read your dashboard numbers
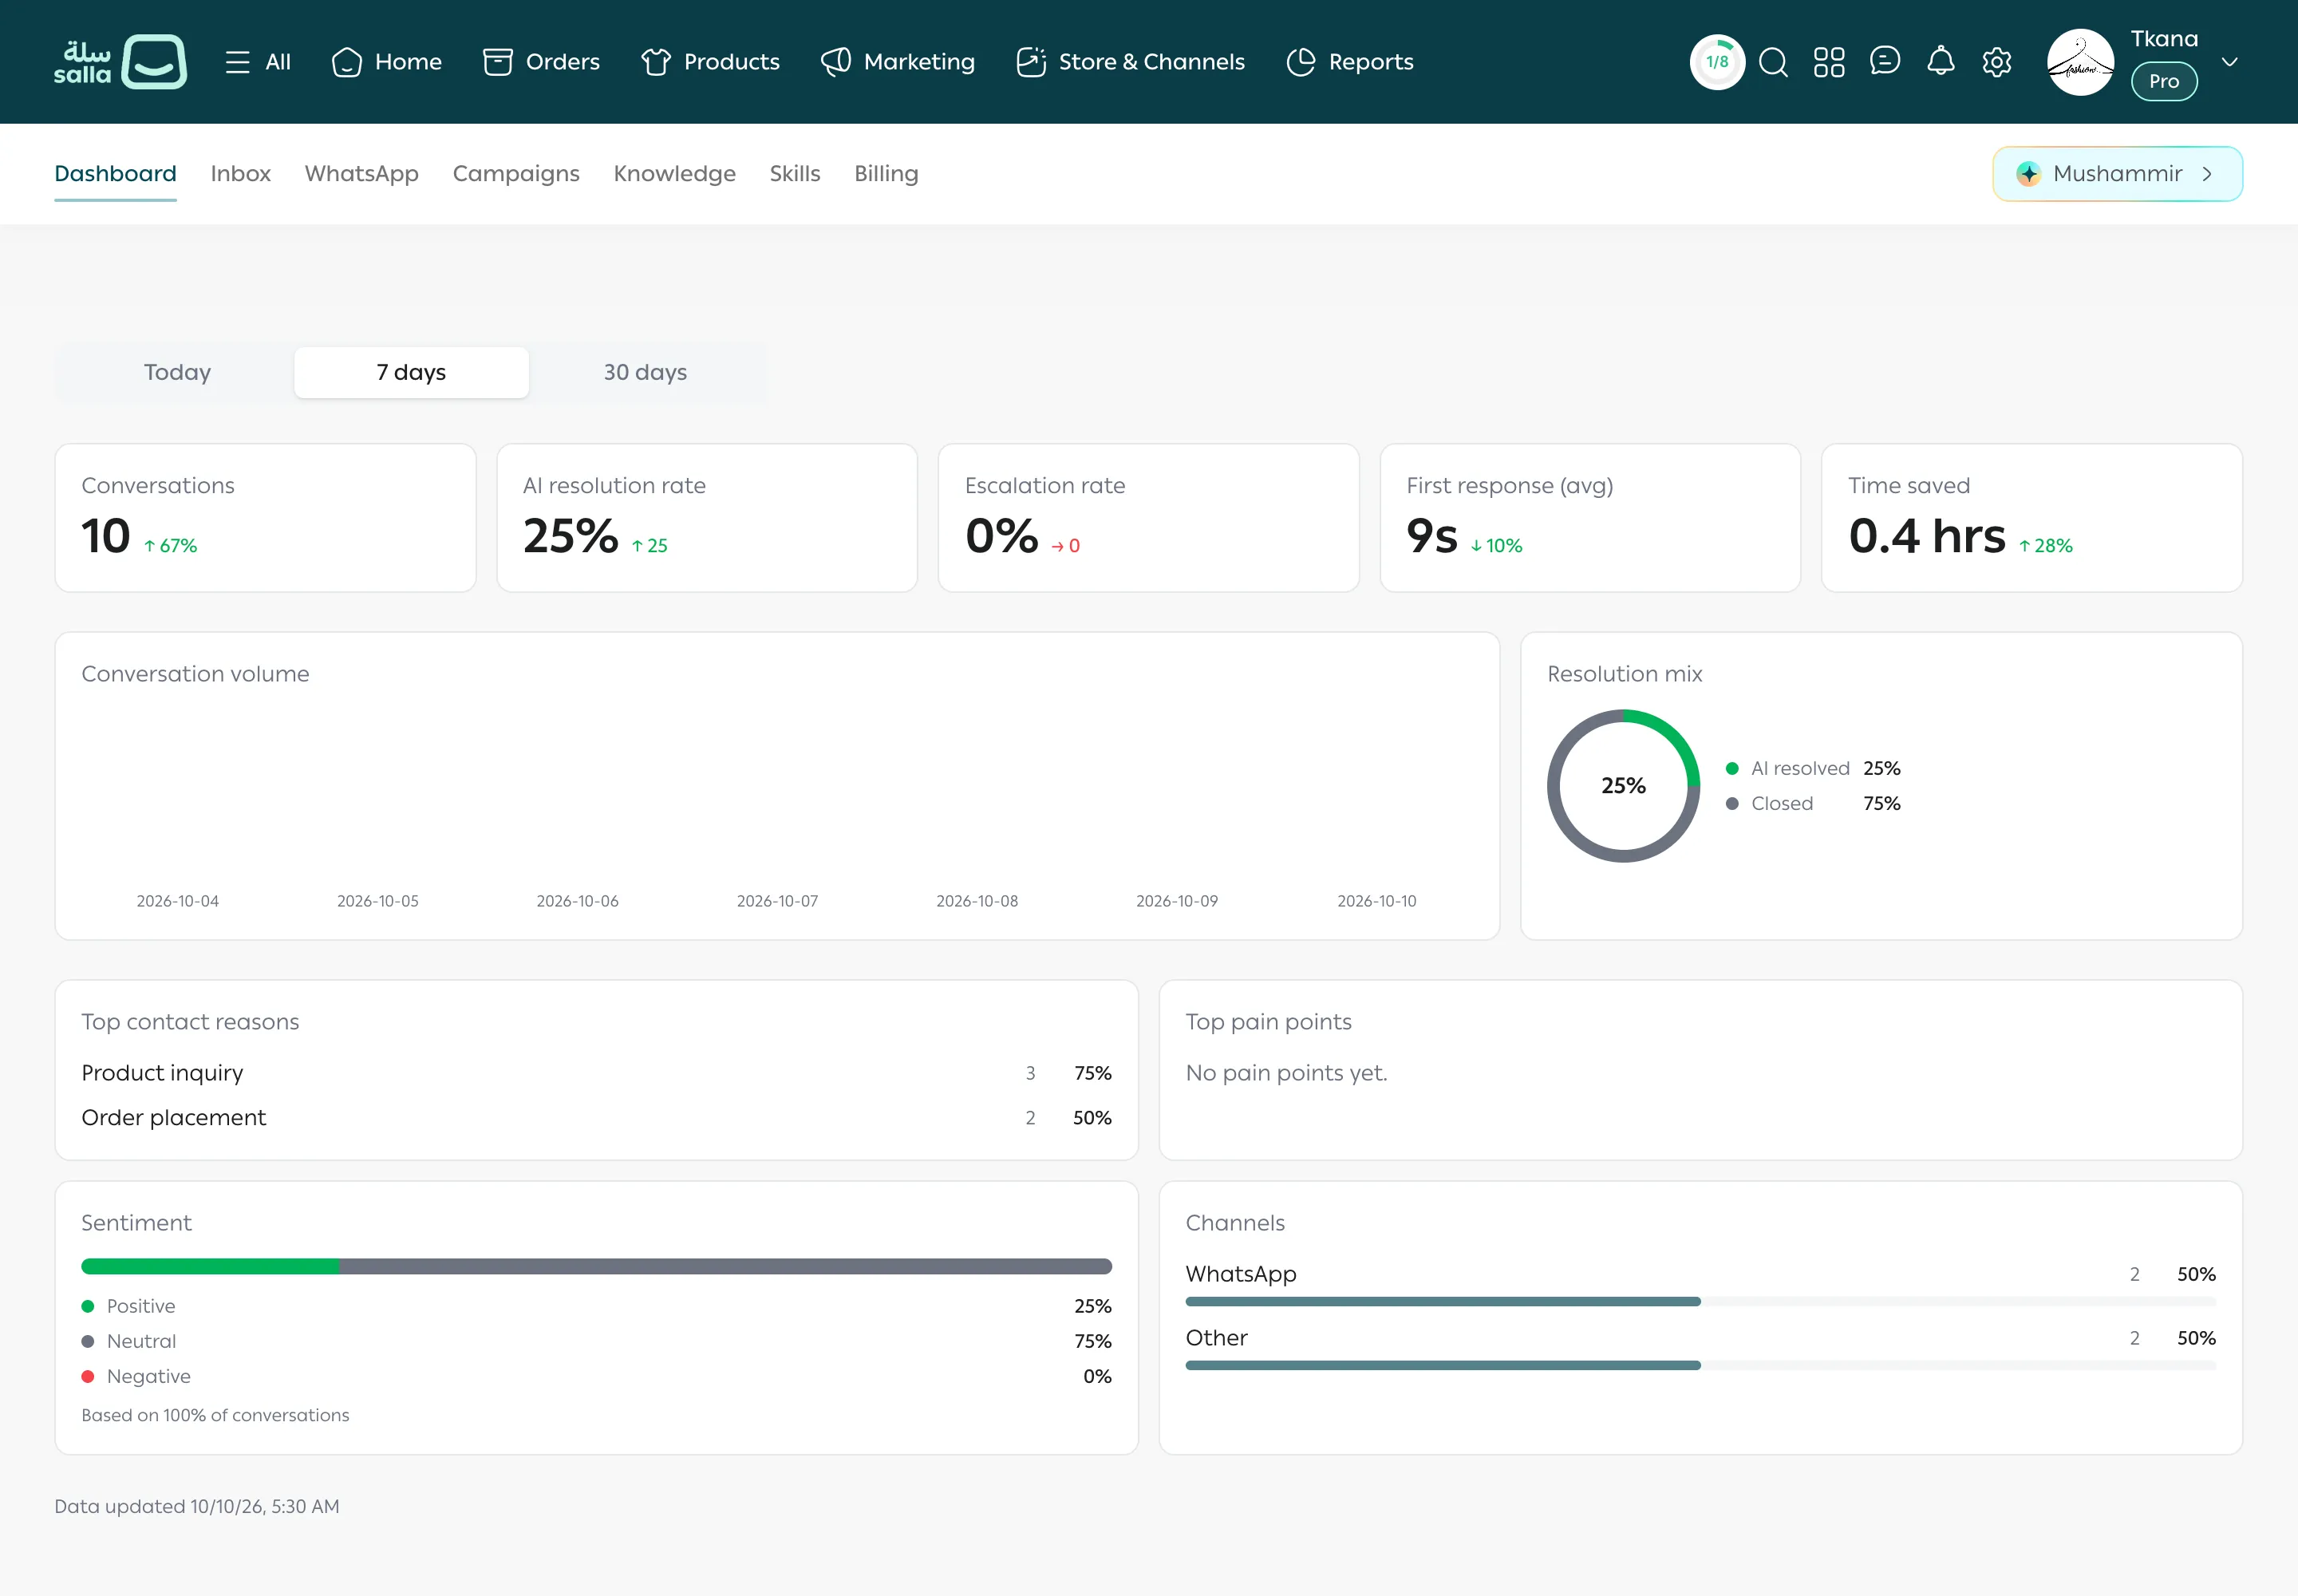
The Dashboard is the first thing you see when you open tkana. It sums up what is happening in your store’s conversations: how many customers contacted you, how many conversations the assistant resolved on its own, and what customers ask about most.
Choose the period
Section titled “Choose the period”-
Open the Dashboard tab.
-
Choose the period at the top of the page: Today, 7 days, or 30 days.
Every card updates to the period you choose.
KPI cards
Section titled “KPI cards”The first row shows five cards:
| Card | What it means |
|---|---|
| Conversations | How many conversations customers started in the period. |
| AI resolution rate | The share of finished conversations the assistant resolved on its own. |
| Escalation rate | The share of finished conversations that needed your team. |
| First response (avg) | How long, on average, a customer waits for the first reply. |
| Time saved | An estimate of the time the assistant saved your team by answering customer messages. |
Next to each number, an arrow and a percentage compare the chosen period with the period right before it. If you choose 7 days, it is compared with the 7 days before that. Green means an improvement and red means a decline. The comparison doesn’t appear when the previous period doesn’t have enough data.
Charts
Section titled “Charts”- Conversation volume: conversations per day in the period, or per hour when you choose Today.
- Resolution mix: how conversations ended: AI resolved, Human resolved, Escalated, or Closed.
- Top contact reasons: the most common reasons customers contacted you, with the number and share of conversations.
- Top pain points: the problems customers mentioned most.
- Sentiment: the share of conversations that were Positive, Neutral, or Negative. The line under the card shows how many conversations the sentiment is based on.
- Channels: where conversations came from, such as WhatsApp.
When the numbers update
Section titled “When the numbers update”The line at the bottom of the page (Data updated) shows when the numbers were last refreshed. A new store’s cards start empty and fill in as soon as customers start messaging you. If you see Some metrics are temporarily unavailable., reopen the page in a little while.
Put the numbers to work
Section titled “Put the numbers to work”- High escalation rate? Open escalated conversations in Inbox and add what the assistant was missing to Knowledge. See Knowledge base good practices.
- A contact reason keeps coming up? Add it as a question and answer in FAQs.
- Slow first response? Make sure AI replies is set to Active on the WhatsApp tab.
Was this article helpful?
Thanks for the feedback, it helps us improve these guides.